Keywords: Nanocharts, sparklines, VBA, in-cell graphing
Version: Tested on Excel 2003.
Download: NanoCharts public beta 0.51 (downloaded 1316 times)
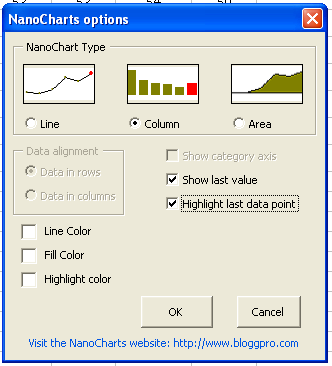
Just a quick heads-up about the latest version of the Nanocharts add-in. I have added some options such as highlighting the last data point, display the last data value and showing the x-axis. The user can also select and customize the colors used for the Nanocharts.
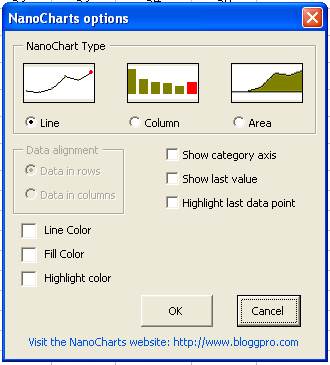
The data orientation is not yet implemented, nor can multiple charts be inserted at once, but these functions will make it into the next release.
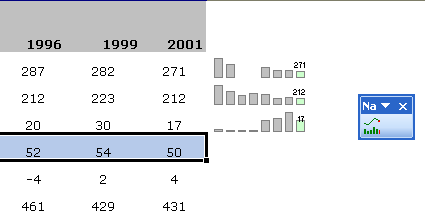
A sample output can be seen in the image below.
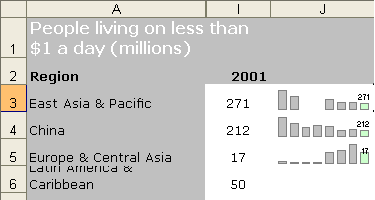
The Nanocharts are by default set to include hidden cells, so by untilizing this and hiding columns you can make extremely readable report summaries, but that still contain the same information density:
Please don’t hesitate to leave feedback, requests and suggestions for the coming development of NanoCharts. See you soon!
Download: NanoCharts public beta 0.51 (downloaded 1316 times)
Popularity: 10% [?]
Wonderful effort with better visuals than commercial packages.
Any plans to issue “final update” with Data in rows as well as column capability?
Thanks
I really like how it works. While it added itself into excel, I can’t use it in other spreadsheets, due a naming conflict. Excel is complaining ” ‘nanocharts_beta_051 (version 1).xls’ could not be found. Check the spelling of the file name, and verify that the file location is correct.”
The file down loaded is ‘nanocharts_beta_051.xls’. Any chance of getting a look at the VBA behind this?
Thanks,
Tom
I get a Run-time error ’1004′
Unable to set the MaximumScale property of the Axis class.
Win XP, Excel 2003
Hi
Im not sure what might cause that problem. If you select and copy the table + charts and then paste special as HTML in word it should work fine? Does for me.
Regards
Jesper
If you copy/paste your table including nanocharts in Word, you’ve got some weird empty box. Do the generated charts consist of 2 layers? Just 1 layer would be easier.
That’s something I want to do actually. Thanks for the input and please check back.
Maybe an idea for your next version, is to have the user select the target cell of the graphic with the options for example: right,bottom,left,user select.
keep up the good work!