Keywords: histogram, normal distribution, Excel 2003, Box-Muller transformation, column chart
Version: Should work with any version. Tested with Excel 2003.
Creating histograms in Excel can be a chore since there is no native function to do this, but by using a few tricks it can still be done with relative ease. First of a we need some data for our histogram. I wanted to show you a normal distribution of a large sample population, but instead of go looking for a data set I create a “random normal distribution” using the Box-Muller transformation. In Excel the formula will look like:
=SQRT(-2*LN(RAND()))*SIN(2*PI()*RAND())
Start by creating a Worksheet looking something like this:
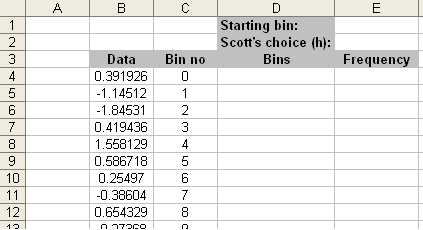
I chose to make my histogram from a population of 3996 data points (simply copy to formula down). Bin no is just a counter, Starting bin is the value where you want your histogram to start. Scott’s choice is one way to calculate a suitable bin width (read more about this at Wikipedia). You need to decide how many bins (or disjoint categories) you want to have in your histogram. In this example I settled for 30.
Under Frequency we will enter an array formula that counts the number of occurances of each bin in the sample population. That’s basically it. Here’s the formulas:
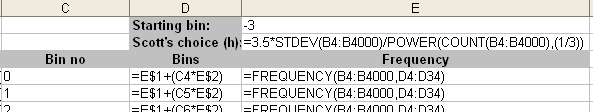
And here are the text format for convenience:
=E$1+(C4*E$2)
=3.5*STDEV(B4:B4000)/POWER(COUNT(B4:B4000),(1/3))
=FREQUENCY(B4:B4000,D4:D34)
Entering the frequency array can be tricky if you are not familiar with the way array formulas are handeld in Excel. To enter this follow these steps.
1. Select the range that will contain your frequency distribution (in this case E4:E34)
2. Enter the frequency fomula in the toolbar text field like in the picture below:
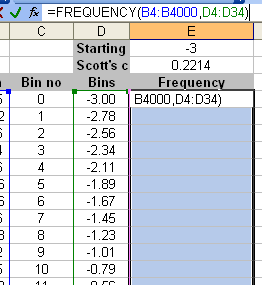
3. After entering the complete formula press shift+CTRL+Enter to tell Excel you want this to be an array formula.
Your worksheet now looks like this:
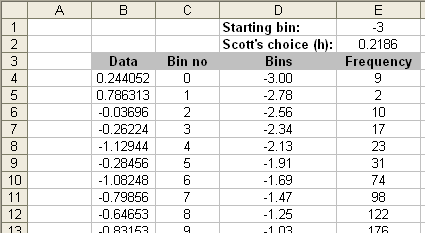
Now it is only a matter of formality to select the range containing your bins and frequency and create a clustered column chart. However the default Excel column chart have a gap between the columns. Traditionally in histograms there should be no gap between columns. This can be achieved by right clicking the data series –> Format data series –> select the Options tab –> Gap width –> set to zero.
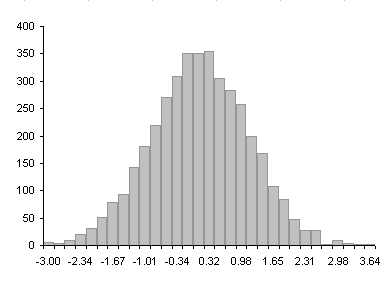
Format the chart to your liking. A sample histogram can be seen below:
Popularity: 19% [?]
Muy Buena informacion muy importante y bien detallada
Excellent work!
Following your example exactly, I see that 4..4000 is 3997 data points, where you say you use 3996. Just wanted to point that out!