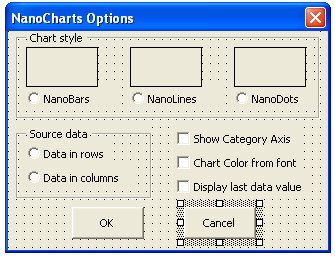
As I decided to develop the NanoCharts (a concept more known as Microcharts or Sparklines) into an Excel add-in I’ve started by specifying features and functionality and came up with the following list:
- Three different types of charts; bar, line and dot
- Possibility to have data in rows or columns
- Selectable chart color
- Optional x-axis
- Option to display last value as number
I started creating a user form for these features (see below) on which I will base the add-in. I’d love to hear suggestions for features, what you would find useful or maybe less useful. Use the comment function.
To give an idea on what the end result may look like I include an example line chart in the picture below.
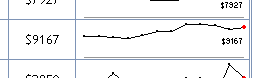
In this example the x-axis is visible, which detracts somewhat from the readability, but if your data have negative values it can be useful in the NanoLine graph for clarity. Another option would be to make markers for negative values a different color. What do you think?
Making the last marker red and slightly larger enhance readability in my opinion. Doing this in VBA is relatively simple:
ActiveChart.SeriesCollection(1).Select
With Selection

                ' Find and select the last marker in the graph

                LastPoint = .Points.Count

                .Points(LastPoint).Select

                ' Change color, size and style of the marker

                With Selection.Border

                .ColorIndex = 1

                .Weight = xlHairline

                .LineStyle = xlContinuous

                End With
With Selection

                .MarkerBackgroundColorIndex = 3

                .MarkerForegroundColorIndex = 3

                .MarkerStyle = xlCircle

                .MarkerSize = 3

                .Shadow = False

                End With
Anyway, the project is moving forward and I hope to be able to upload a beta soon. Until then.
Popularity: 12% [?]
Are you very busy at the moment? buy cheap nolvadex online http://www.stumbleupon.com/stumbler/med-brother/ buy cheap nolvadex online See you soon!
Are you very busy at the moment? buy clenbuterol nolvadex online buy mexican clenbuterol nolvadex online
buy chemical citrate nolvadex research tamoxifen Give my regards to your sister.
best search engine
neploxo tak, i`m glad,
Hi , Juan Brylandt Miller was my brother , I did a search on the website , because the is a blog of how he was murdered and came across this responds he sent you guys last year , he was brutally murdered by his wife while he was asleep on the 02nd March , he was a loving , kind and intelligent person and will be missed dearly.
I think your nano charts are gr8. Can you maybe make this link the data to a pivot table